Real-Time Ping Latency Monitoring with Python

A code-dependent life form.
Introduction
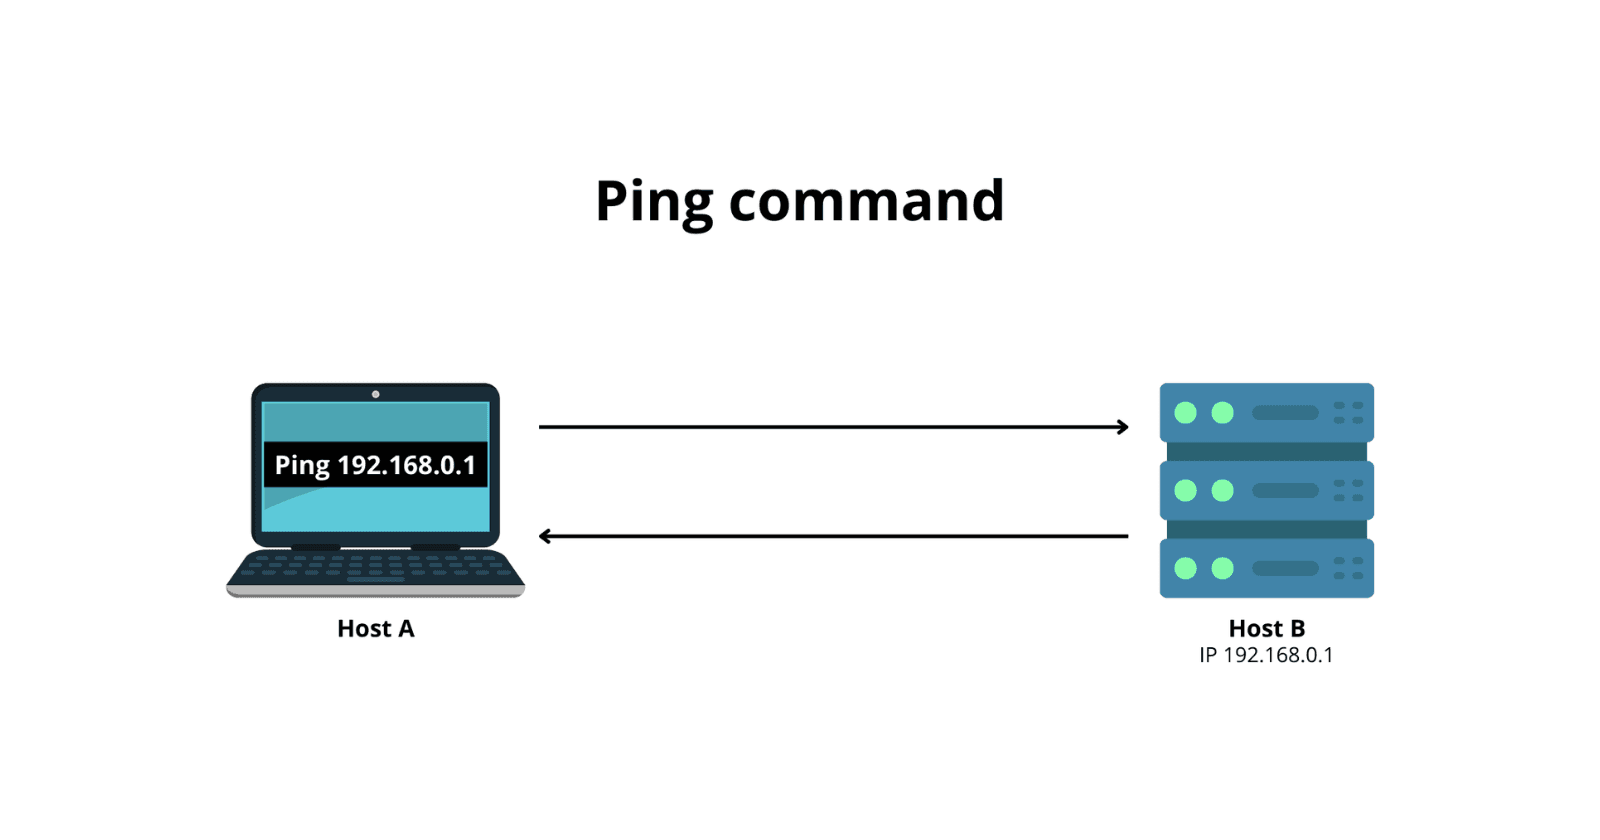
Monitoring network performance and latency is crucial for maintaining a stable and responsive network infrastructure. In this blog post, we'll explore a Python script that leverages the ping command to continuously measure and visualize the latency of an IP address in real time. This script provides valuable insights into network performance, making it useful for network monitoring, troubleshooting, and analyzing latency trends over time.
The script utilizes Python's subprocess module to execute the ping command, captures the output, extracts latency information using regular expressions, and visualizes the latency data using matplotlib library. By running the script, you can observe the latency trends over a specified duration, enabling you to detect any network performance issues or anomalies.
Advantages
There are several advantages to using this script for monitoring network latency:
Real-time monitoring: The script continuously pings the specified IP address and updates the latency graph in real time, allowing you to monitor latency changes as they occur.
Visual representation: The latency data is visualized using a line graph, providing a clear and intuitive representation of latency trends over time. Visualizing the data makes it easier to identify patterns, spikes, or fluctuations in latency.
Customizable: You can easily modify the script to suit your needs. For example, you can adjust the duration of the monitoring, change the IP address to ping or customize the graph appearance.
Now, let's dive into the code and understand how it works.
Source Code - Here
Code Walkthrough
import subprocess
import re
import time
import matplotlib.pyplot as plt
The script begins by importing the necessary modules: subprocess for executing the ping command, re for regular expression matching, time for tracking time intervals, and matplotlib.pyplot for visualizing the latency graph.
class PingGraph:
    def __init__(self, ip_address, duration):
        self.ip_address = ip_address
        self.duration = duration
        self.timestamps = []
        self.latencies = []
        self.start_time = time.time()
        self.end_time = self.start_time + duration
Next, a class named PingGraph is defined to encapsulate the functionality of the script. The class constructor initializes the ip_address and duration attributes, as well as empty lists to store timestamps and latencies. It also records the start time and calculates the end time for monitoring.
    def update_graph(self):
        while time.time() < self.end_time:
            output = subprocess.Popen(['ping', '-c', '1', self.ip_address], stdout=subprocess.PIPE).communicate()[0].decode('utf-8')
            latency = re.search(r'time=(\d+.\d+)', output)
The update_graph method is responsible for continuously pinging the specified IP address and updating the latency graph. It uses a while loop that runs until the current time exceeds the end time. Within the loop, it executes the ping command using subprocess.Popen captures the output and extracts the latency value using a regular expression.
            if latency:
                elapsed_time = time.time() - self.start_time
                self.timestamps.append(elapsed_time)
                self.latencies.append(float(latency.group(1)))

                plt.clf()
                plt.plot(self.timestamps, self.latencies, marker='o')
                plt.xlabel('Time (s)')
                plt.ylabel('Latency (ms)')
                plt.title('Ping Latency Over Time')
                plt.grid(True)
                plt.ylim(bottom=0, top=max(self.latencies)+10)
                plt.xticks(rotation=45)

                current_latency = self.latencies[-1]
                avg_latency = sum(self.latencies) / len(self.latencies)
                min_latency = min(self.latencies)
                max_latency = max(self.latencies)

                plt.text(0.02, 0.92, f'Current: {current_latency:.2f} ms', transform=plt.gca().transAxes)
                plt.text(0.02, 0.86, f'Average: {avg_latency:.2f} ms', transform=plt.gca().transAxes)
                plt.text(0.02, 0.80, f'Minimum: {min_latency:.2f} ms', transform=plt.gca().transAxes)
                plt.text(0.02, 0.74, f'Maximum: {max_latency:.2f} ms', transform=plt.gca().transAxes)

                plt.pause(0.1)
Within the update_graph method, if a valid latency value is obtained from the output, it calculates the elapsed time since the monitoring started, appends the elapsed time to the timestamps list, and appends the extracted latency value (converted to a float) to the latencies list.
Then, the method proceeds to update the latency graph using matplotlib.pyplot. It clears the previous plot using plt.clf(), plots the timestamps on the x-axis and latencies on the y-axis, and adds markers to the data points. The method also sets the labels, title, and grid for the graph.
Next, it calculates the current, average, minimum, and maximum latency values. These values are displayed as text on the graph using plt.text(). The transform=plt.gca().transAxes parameter ensures that the text is positioned relative to the axes.
Finally, plt.pause(0.1) pauses the graph display for a short duration (0.1 seconds) to allow for smooth real-time updates.
    def run(self):
        plt.ion()
        self.update_graph()
        plt.ioff()
        plt.show()

ip_address = input('Enter IP address to ping: ')
duration = int(input('Enter duration to ping (in seconds): '))

ping_graph = PingGraph(ip_address, duration)
ping_graph.run()
The run method sets the interactive mode of matplotlib using plt.ion(). It then calls the update_graph method to start the real-time monitoring and graph updates. After the monitoring duration ends, plt.ioff() is called to turn off interactive mode, and plt.show() displays the final latency graph.
Finally, the script prompts the user to enter an IP address to ping and the duration of the monitoring in seconds. An instance of the PingGraph class is created with the provided IP address and duration, and the run method is called to initiate the monitoring process.
Test the script
ip_address = input('Enter IP address to ping: ') # 8.8.8.8
duration = int(input('Enter duration to ping (in seconds): ')) # 20
The following graph will be generated if we run the script with test inputs.

Conclusion
In this blog post, we explored a Python script that uses the ping command to continuously measure and visualize the latency of an IP address in real time. By leveraging the subprocess, re, and matplotlib modules, the script enables network latency monitoring, troubleshooting, and analysis. The real-time visualization of latency trends allows for the proactive detection of network performance issues, facilitating efficient network management and troubleshooting.
Feel free to customize and adapt the script to meet your specific requirements. Happy monitoring!


