Watching the Black Box
A code-dependent life form.
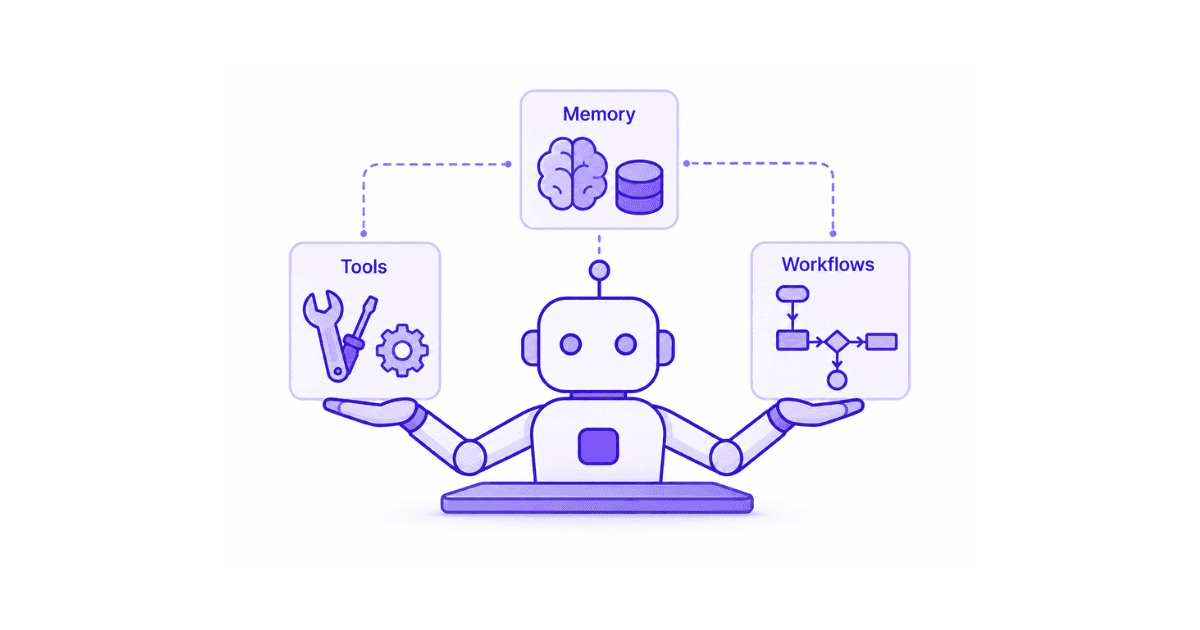
The final part of a series on agent harnesses. We started with the model-plus-harness idea, then built subagents, gave them a safe place to work, and wired up tools, memory, and workflows. This last piece is about the thing you need the moment any of it runs for real: being able to see what happened.
Here is a small, uncomfortable truth about agents. The day yours goes live is the day it starts doing things you did not watch. A workflow finishes in three seconds or thirty. A prompt quietly burns through ten times the tokens you expected. A tool call fails, the model recovers, and the user never notices, until one day it does not recover. None of that shows up in the answer the agent returns. You have to go looking for it.
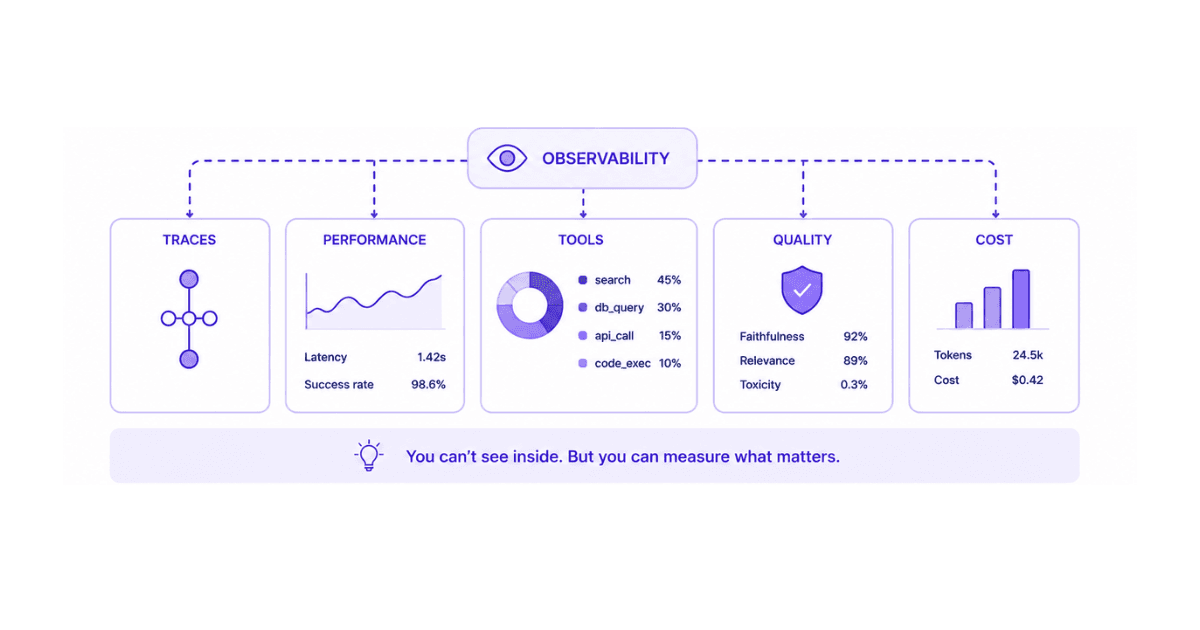
Observability is how you look. It answers four plain questions about your agents: did the work finish, did it fail, was it slow, and did it cost more than it should have. Flue gives you three ways to get those answers, from inspecting a single run after the fact to streaming live activity across your whole application.
Why you cannot just read the output
A model's answer tells you what it decided, not how it got there. The interesting failures all live in the gap between the request and the response:
Silent slowness. One prompt can fan out into several model turns and tool calls. The reply looks fine, but it took eight seconds, and nothing in the text says why.
Quiet cost. Tokens and dollars accumulate inside operations you never see directly. Without measurement, your first signal is the bill.
Recovered errors. An agent often hits a failing tool call, tries again, and succeeds. That is healthy, but if you treat every nested error as an incident you drown in false alarms, and if you ignore them all you miss the real ones.
Observability is about making this hidden activity visible enough to act on, without turning every hiccup into a page at 3am.
Layer one: inspect a single run
Every workflow invocation gets a runId, and its run history records the result or error plus the activity produced along the way. The most useful habit is to add your own structured logs for facts the runtime cannot infer on its own:
export async function run({ init, log, payload }: FlueContext<{ text: string }>) {
  log.info('Summarization requested', { characters: payload.text.length });

  const harness = await init(summarizer);
  const session = await harness.session();
  const response = await session.prompt(payload.text);

  log.info('Summarization completed', {
    tokens: response.usage.totalTokens,
    cost: response.usage.cost.total,
  });

  return { summary: response.text };
}
The log.info, log.warn, and log.error methods take structured attributes, not just a message. That matters because attributes are what you later search, aggregate, or forward to a monitoring system. Recording characters, tokens, and cost as fields means you can answer "which runs were expensive" later, instead of grepping through prose.
Once a run has an ID, you can pull its history from the command line:
pnpm exec flue logs <runId> --server http://localhost:3583
One scoping note worth remembering: flue logs is for workflows only. A direct prompt to a continuing agent, or input delivered through dispatch(...), is activity in an agent session, not a workflow run, so you watch it a different way.
Layer two: observe live activity
For everything happening across your application, including continuing agents, register observe(...) in your entry point. It receives activity as it is emitted, so you can react to failures, slowness, and errors in real time:
observe((event) => {
  if (event.type === 'run_end' && event.isError) {
    console.error('Workflow failed', event.runId, event.error);
  }

  if (event.type === 'operation' && event.durationMs > 5_000) {
    console.warn('Slow operation', event.operationKind, event.durationMs);
  }

  if (event.type === 'log' && event.level === 'error') {
    console.error(event.message, event.attributes);
  }
});
The unit to watch here is the operation: a finite boundary like prompting a session, running a skill, or delegating to a subagent. This is what makes a continuing agent observable without pretending it is a stream of workflow runs.

When an operation is slow or expensive, its nested activity is the explanation. One prompt may contain several model turns and tool calls, and each model turn exposes its own latency, token usage, and cost. That is where you find the actual culprit.
One discipline with observe(...): keep the callback light. It runs while Flue is emitting activity, so filter events, record a metric, or enqueue exporter work, rather than doing anything blocking inside it.
Layer three: export telemetry
When you already run monitoring infrastructure, you do not want to hand-roll any of this. If your stack uses OpenTelemetry, register Flue's adapter and the activity flows straight into your existing tracing:
import { createOpenTelemetryObserver } from '@flue/opentelemetry';
import { observe } from '@flue/runtime';

observe(createOpenTelemetryObserver());
The adapter turns workflow runs, operations, model turns, tools, delegated tasks, and logs into trace activity automatically. From there it lands in whatever backend you already use, alongside the rest of your services.

Optimizing what you watch
More telemetry is not better telemetry. A few habits keep it useful.
Start with outcomes, not everything. Track the signals that describe results first: failed workflows, explicit error logs, slow operations, and completed model usage. These tell you something is wrong without burying you in detail.
Do not alert on every nested error. Because an agent can fail a tool call and then recover, treating each nested error as an incident creates noisy, low-trust alerts. Watch terminal failures and let recoverable ones stay as quieter signal.
Log attributes, not sentences. A message like "took a while" is useless later. Structured fields such as
tokens,cost, anddurationMsare searchable and aggregatable, which is the whole point.Aggregate across instances deliberately. In a distributed deployment, each running context only observes the activity it handles. If you need a whole-system view, send telemetry to an external backend rather than expecting one instance to see it all.
Best practices
A short checklist for watching agents in production:
Measure timing, cost, and errors before content. Outcome metadata answers most operational questions. Reach for prompts and outputs only when an investigation genuinely needs them.
Redact before you export. Telemetry can carry sensitive data: workflow payloads, prompts, outputs, and tool arguments. If you capture content, strip secrets and personal data before it leaves your application.
Keep observer callbacks cheap. Filter, record, or enqueue. Never block inside an observer, because it runs in the path of live activity.
Use the right tool for the surface.
flue logsfor workflow runs,observe(...)for continuing agents and application-wide activity. Matching the tool to the work saves confusion.Treat cost as a first-class signal. Token usage and spend are as real as latency. Logging them from day one means you notice a runaway agent early, not on the invoice.
Closing the series
That is the whole picture. An agent is a model plus a harness, and across these five articles we have built that harness one layer at a time: the core loop, specialists that share the load, a sandbox to work in safely, the tools and memory and workflows that make it useful, and now the observability to see what it does once it is live. None of these layers is exotic. Each one is a small, sensible answer to a problem the previous layer created.
The best next step is the one that has worked all along: build the small version. Take a workflow you already have, add a couple of structured logs and an observe(...) callback, and watch a real run go by. Once you can see what your agent is doing, you can make it better with confidence instead of guesswork. The Flue observability guide has the full set of events and adapters when you are ready to wire it into production.
If you ever need help or just want to chat, DM me on Twitter / X or LinkedIn.